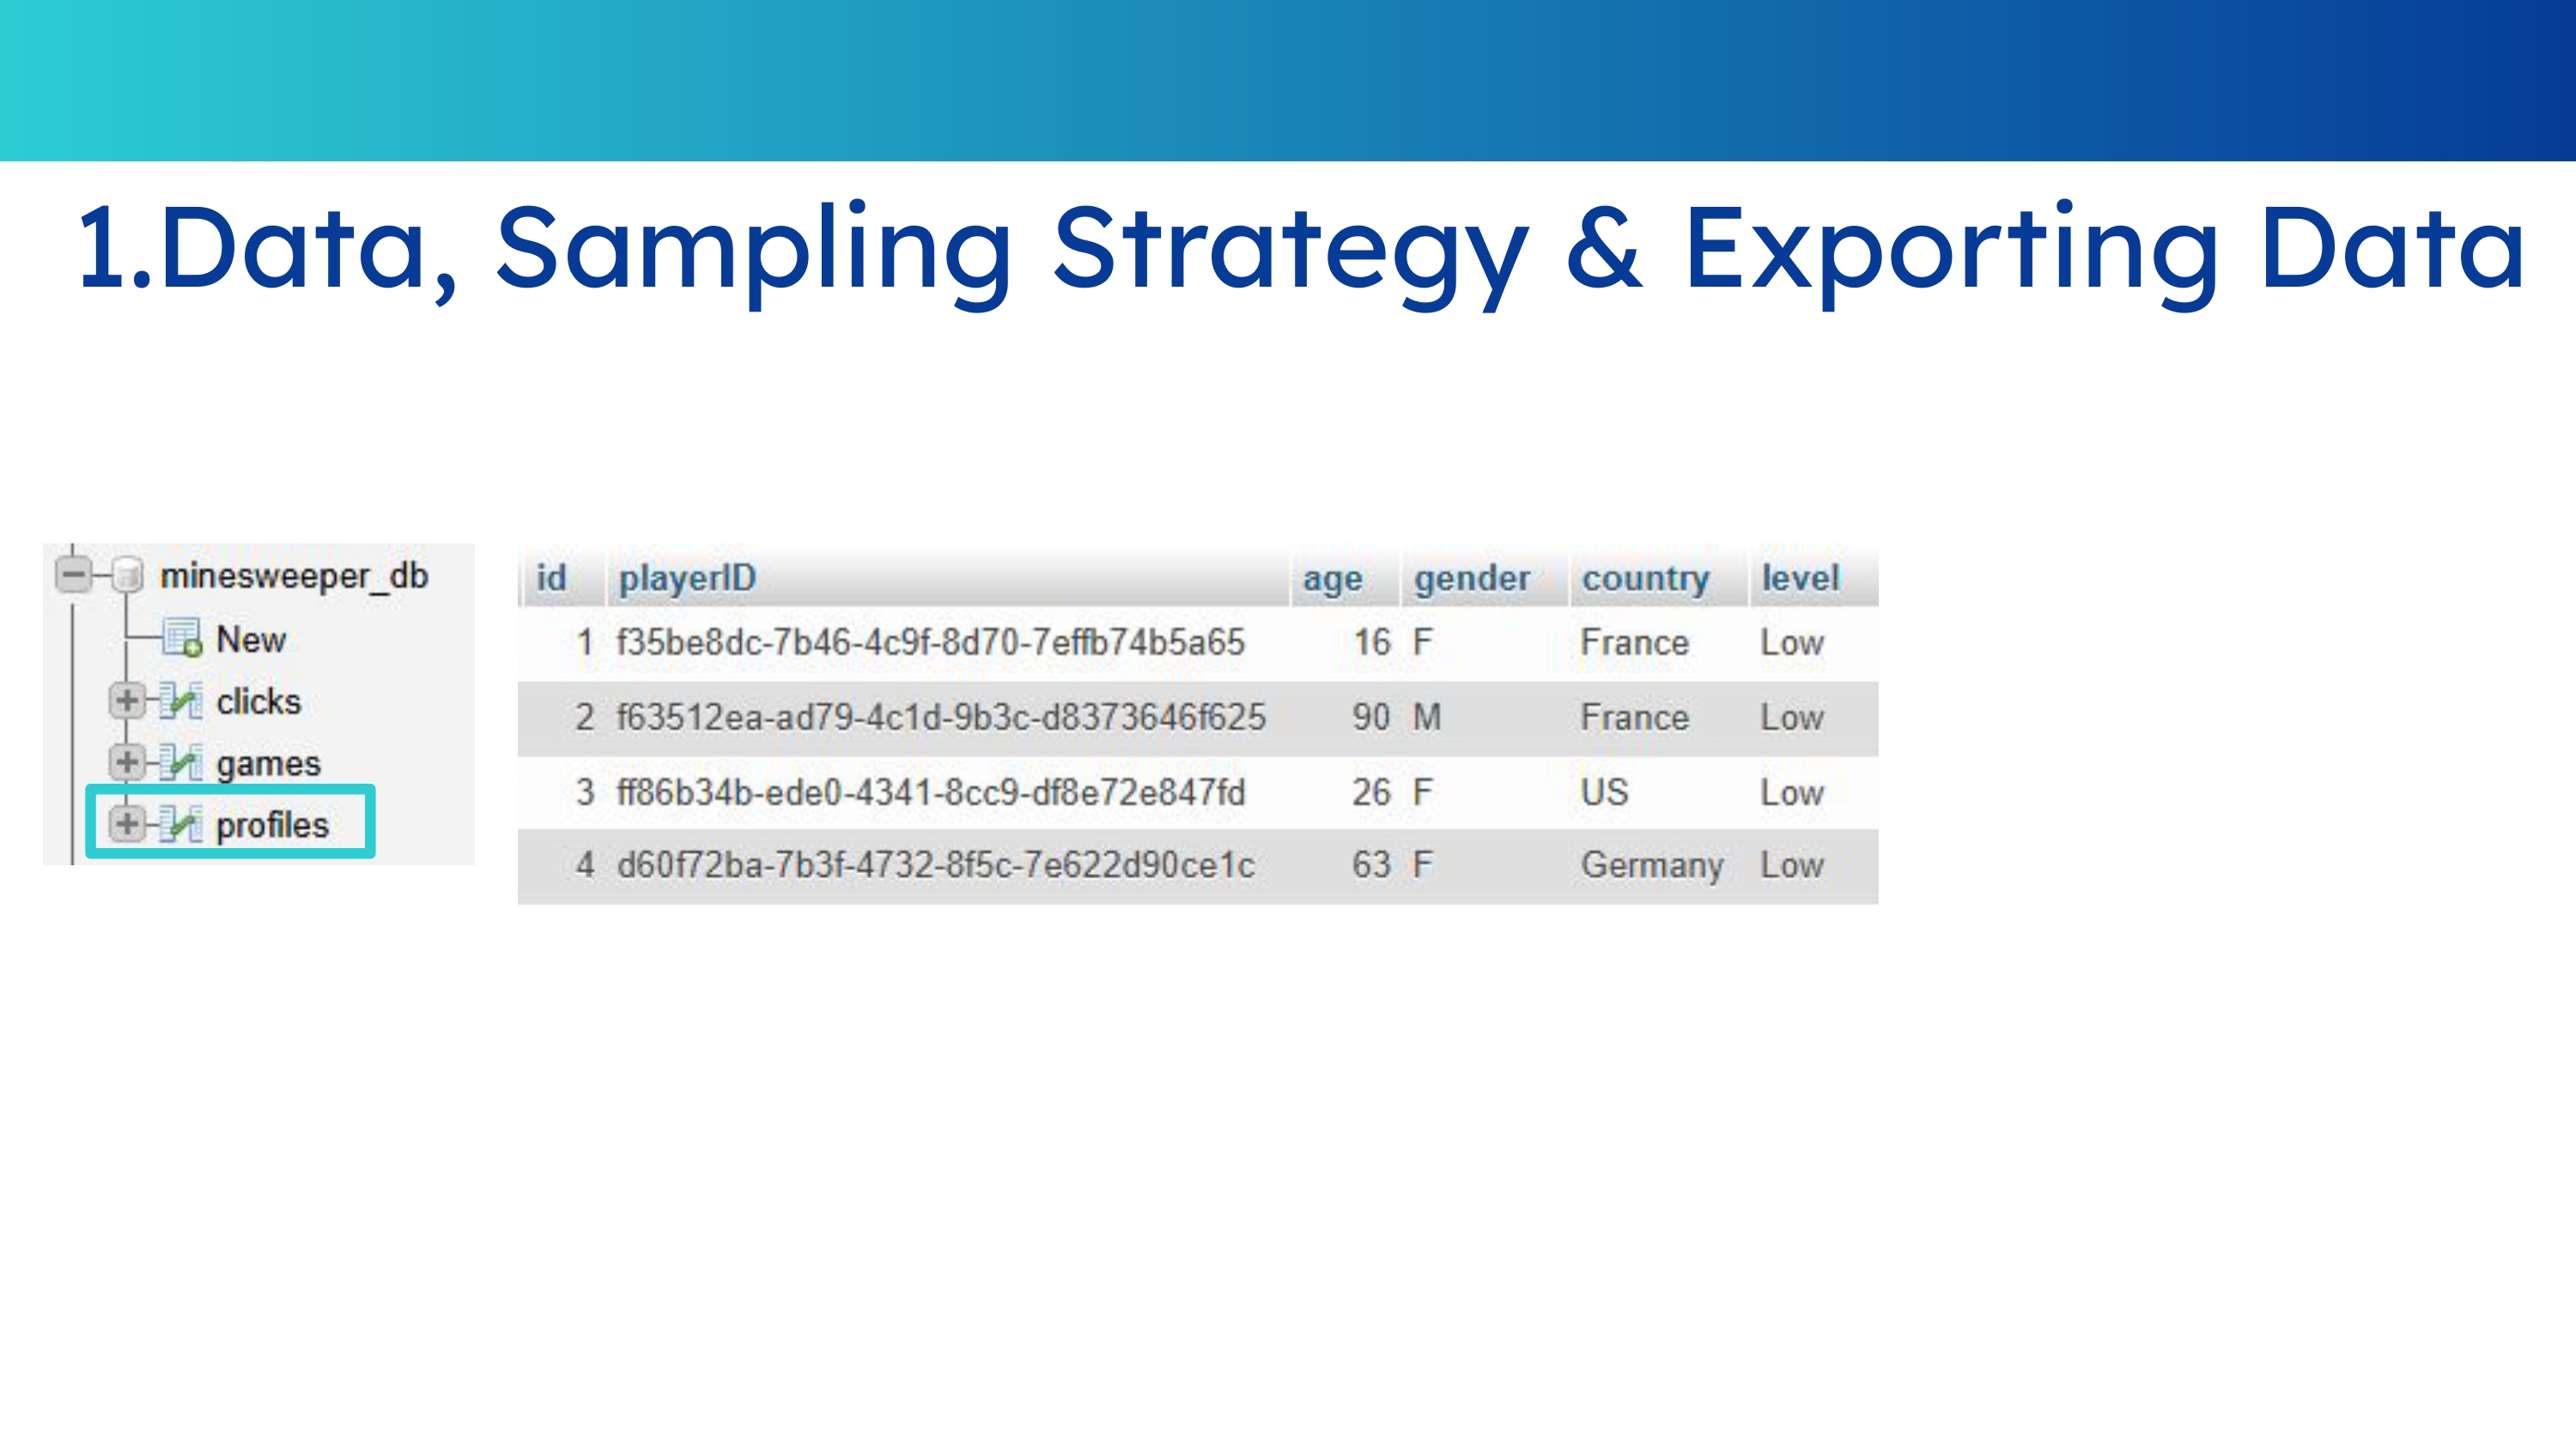
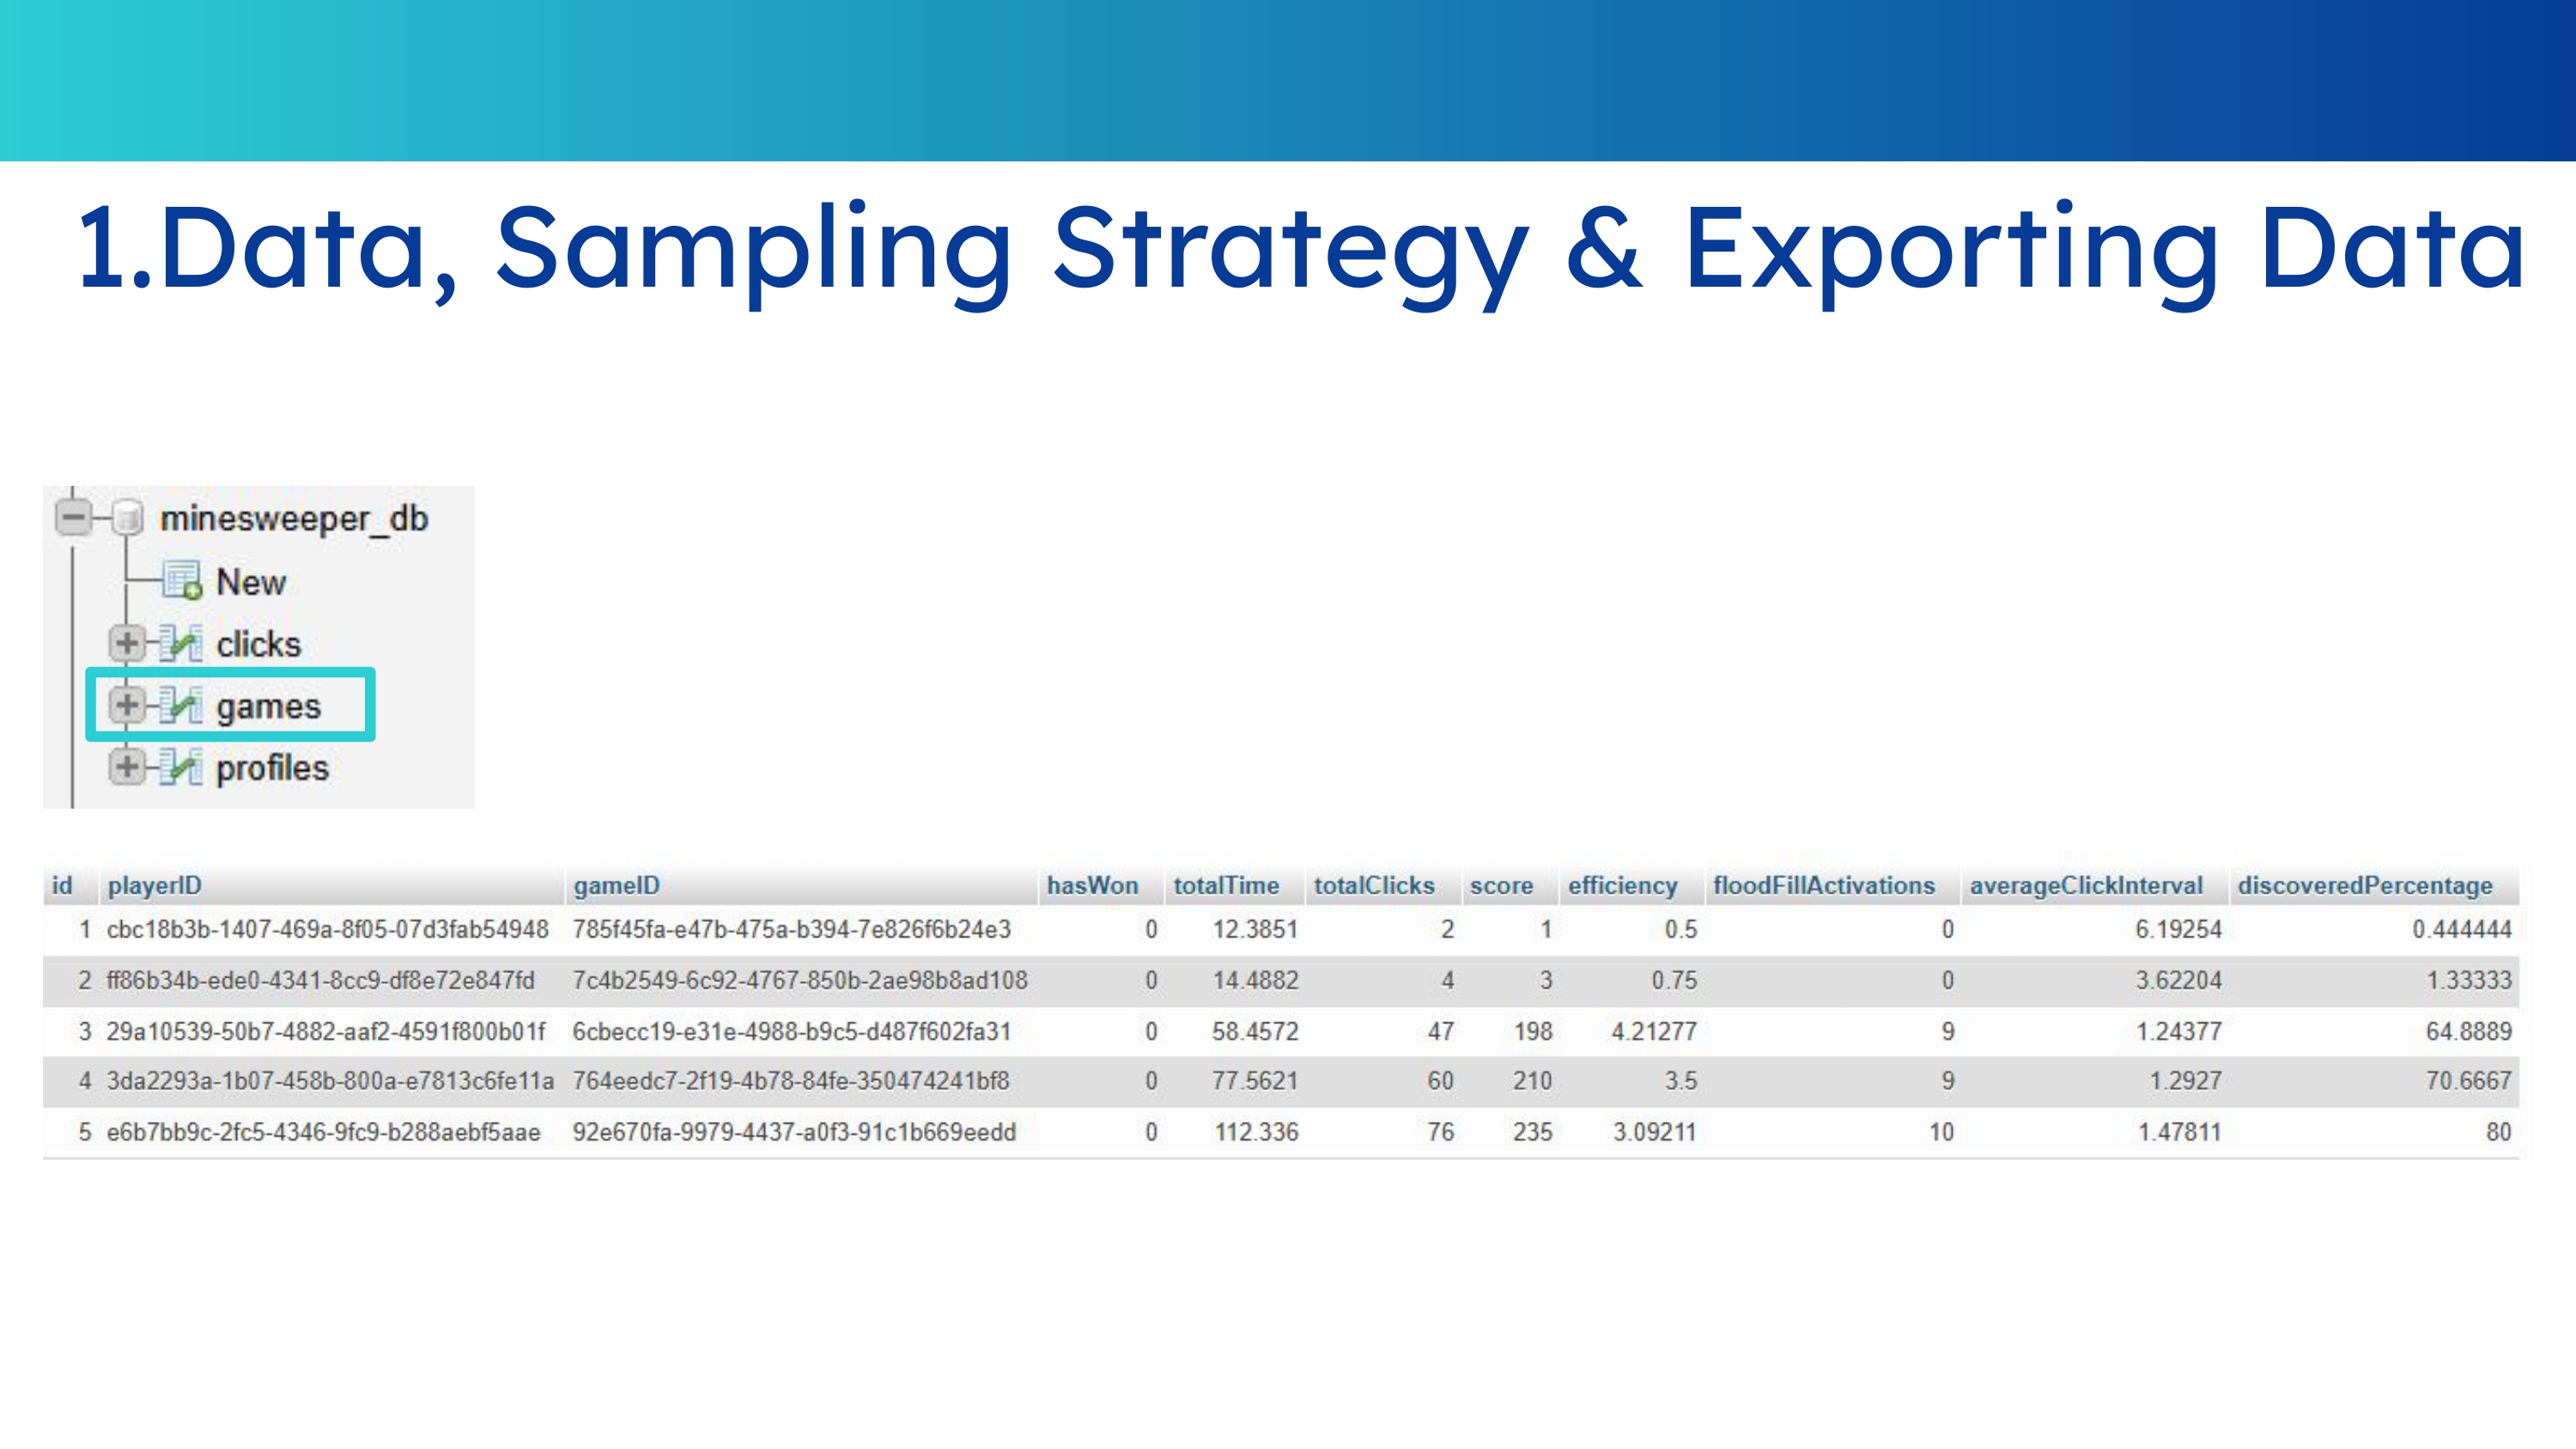
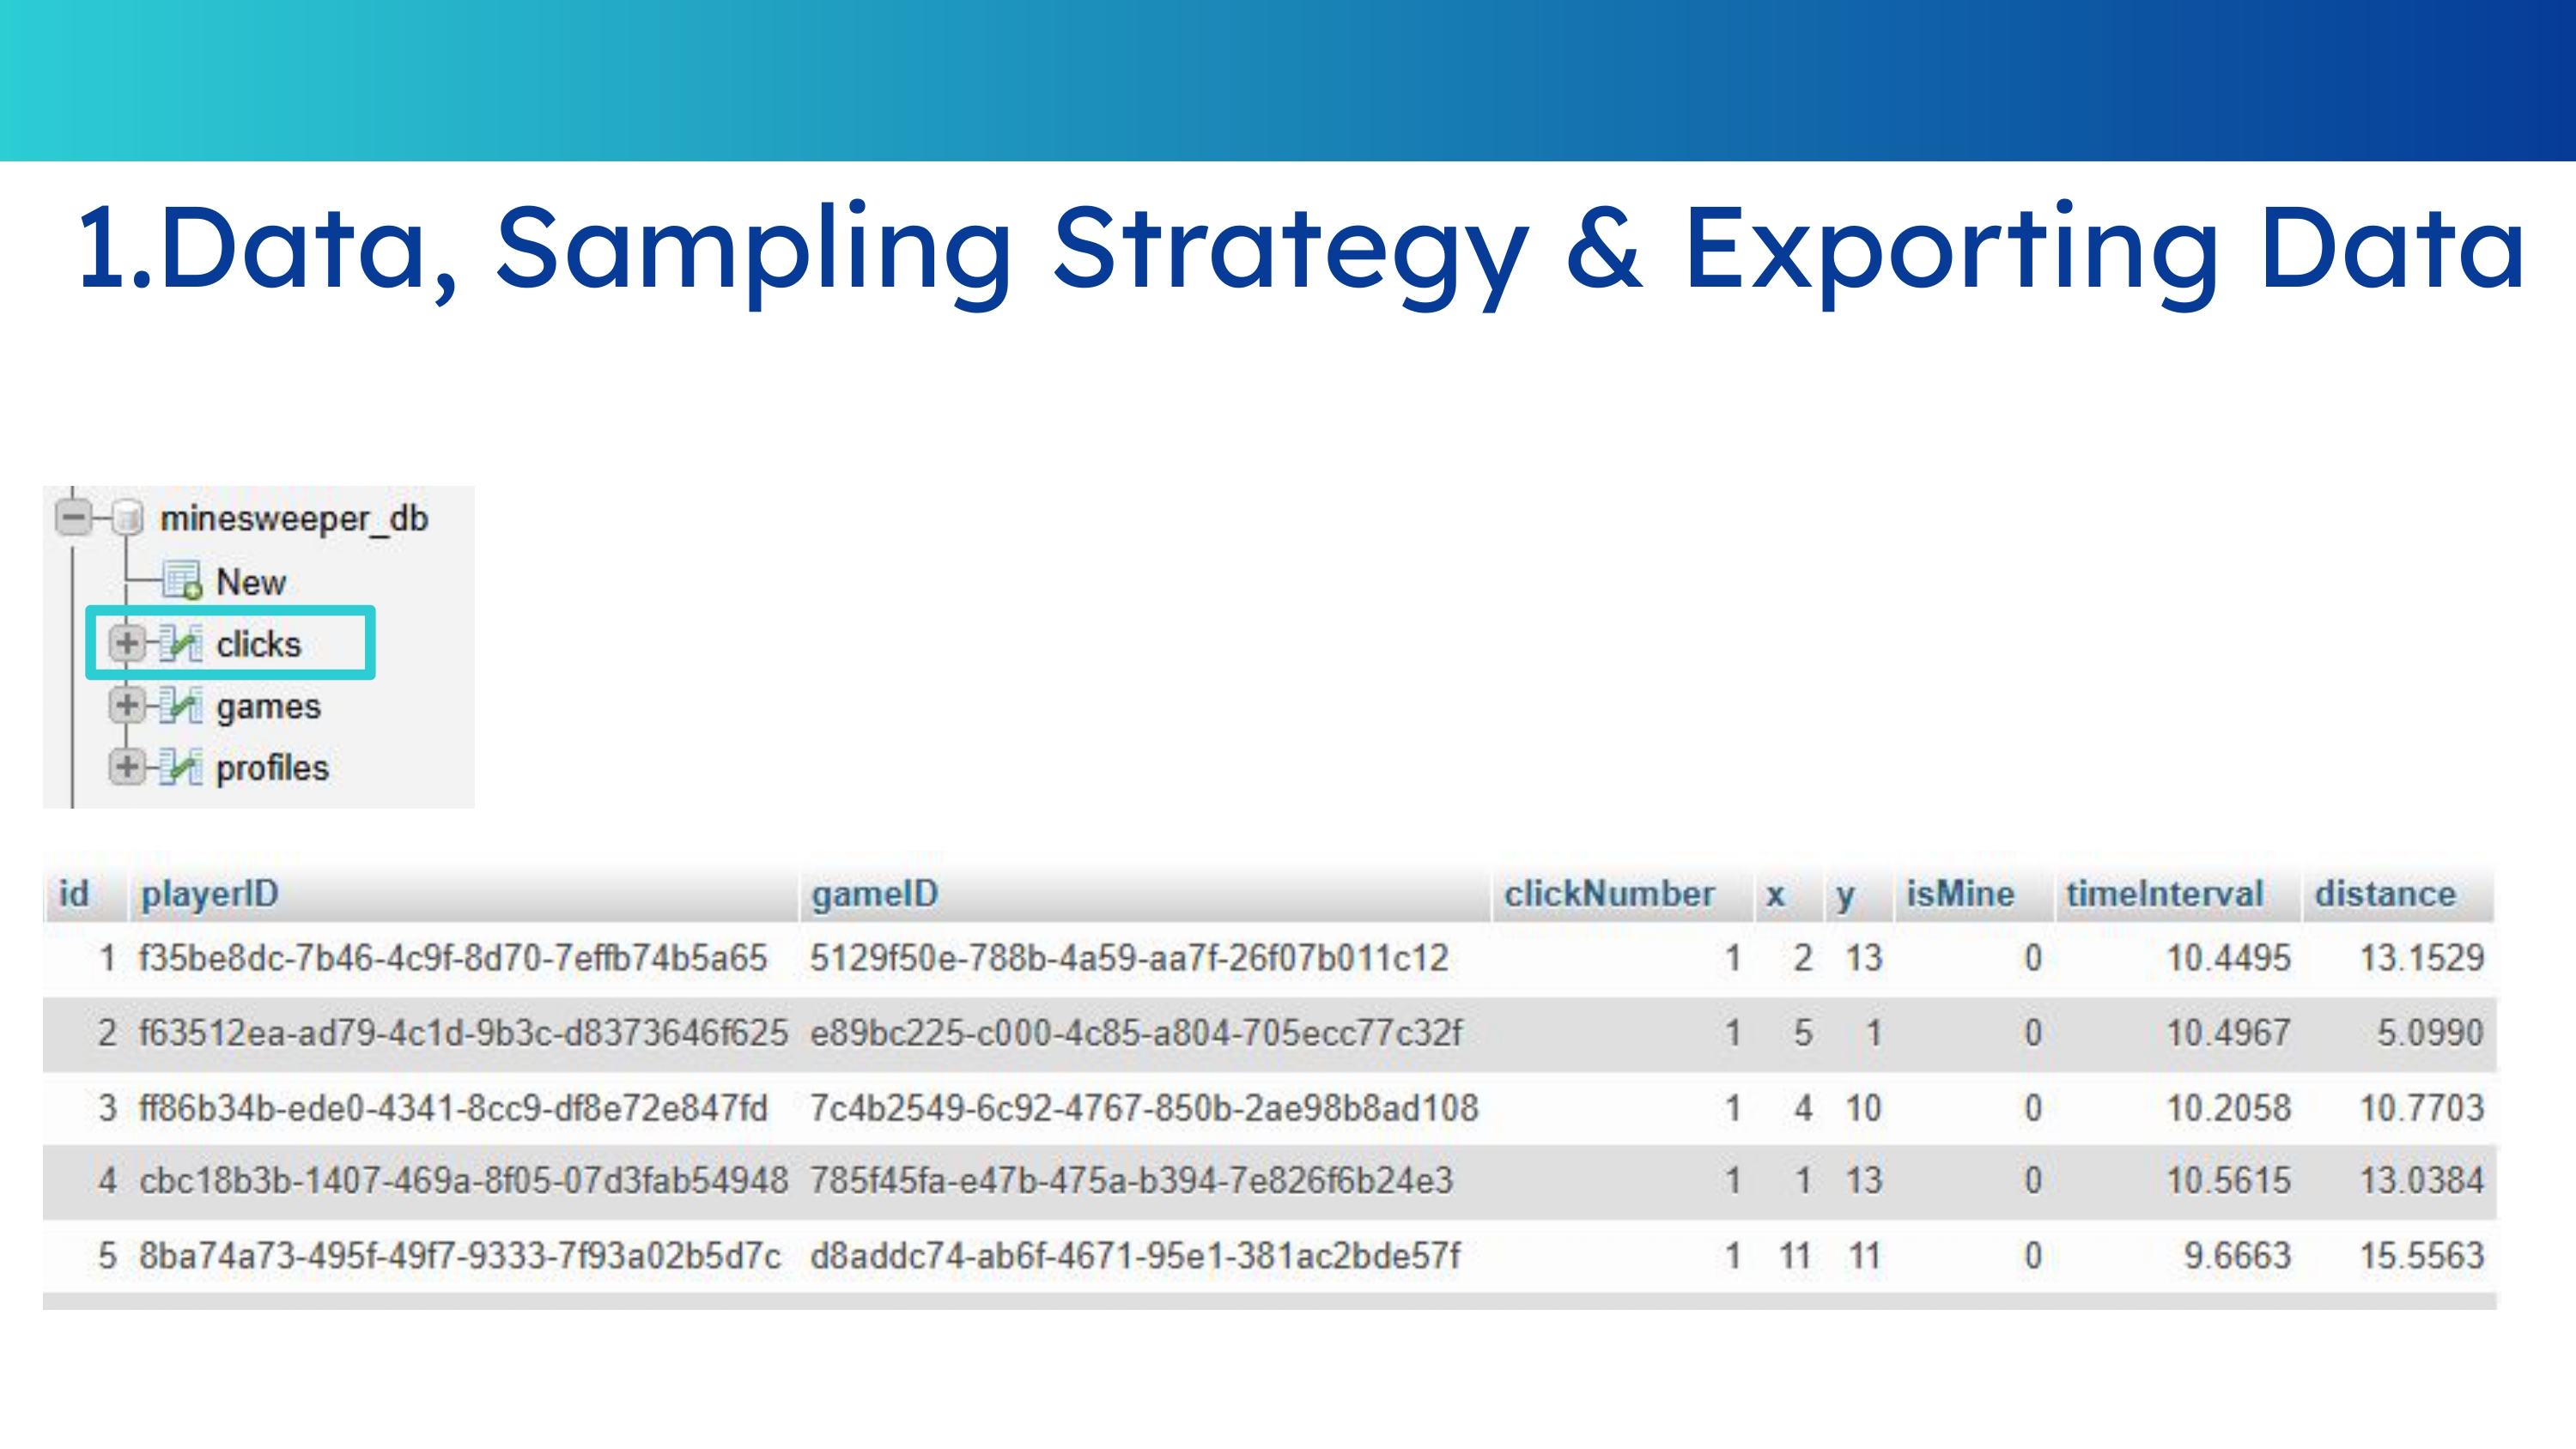
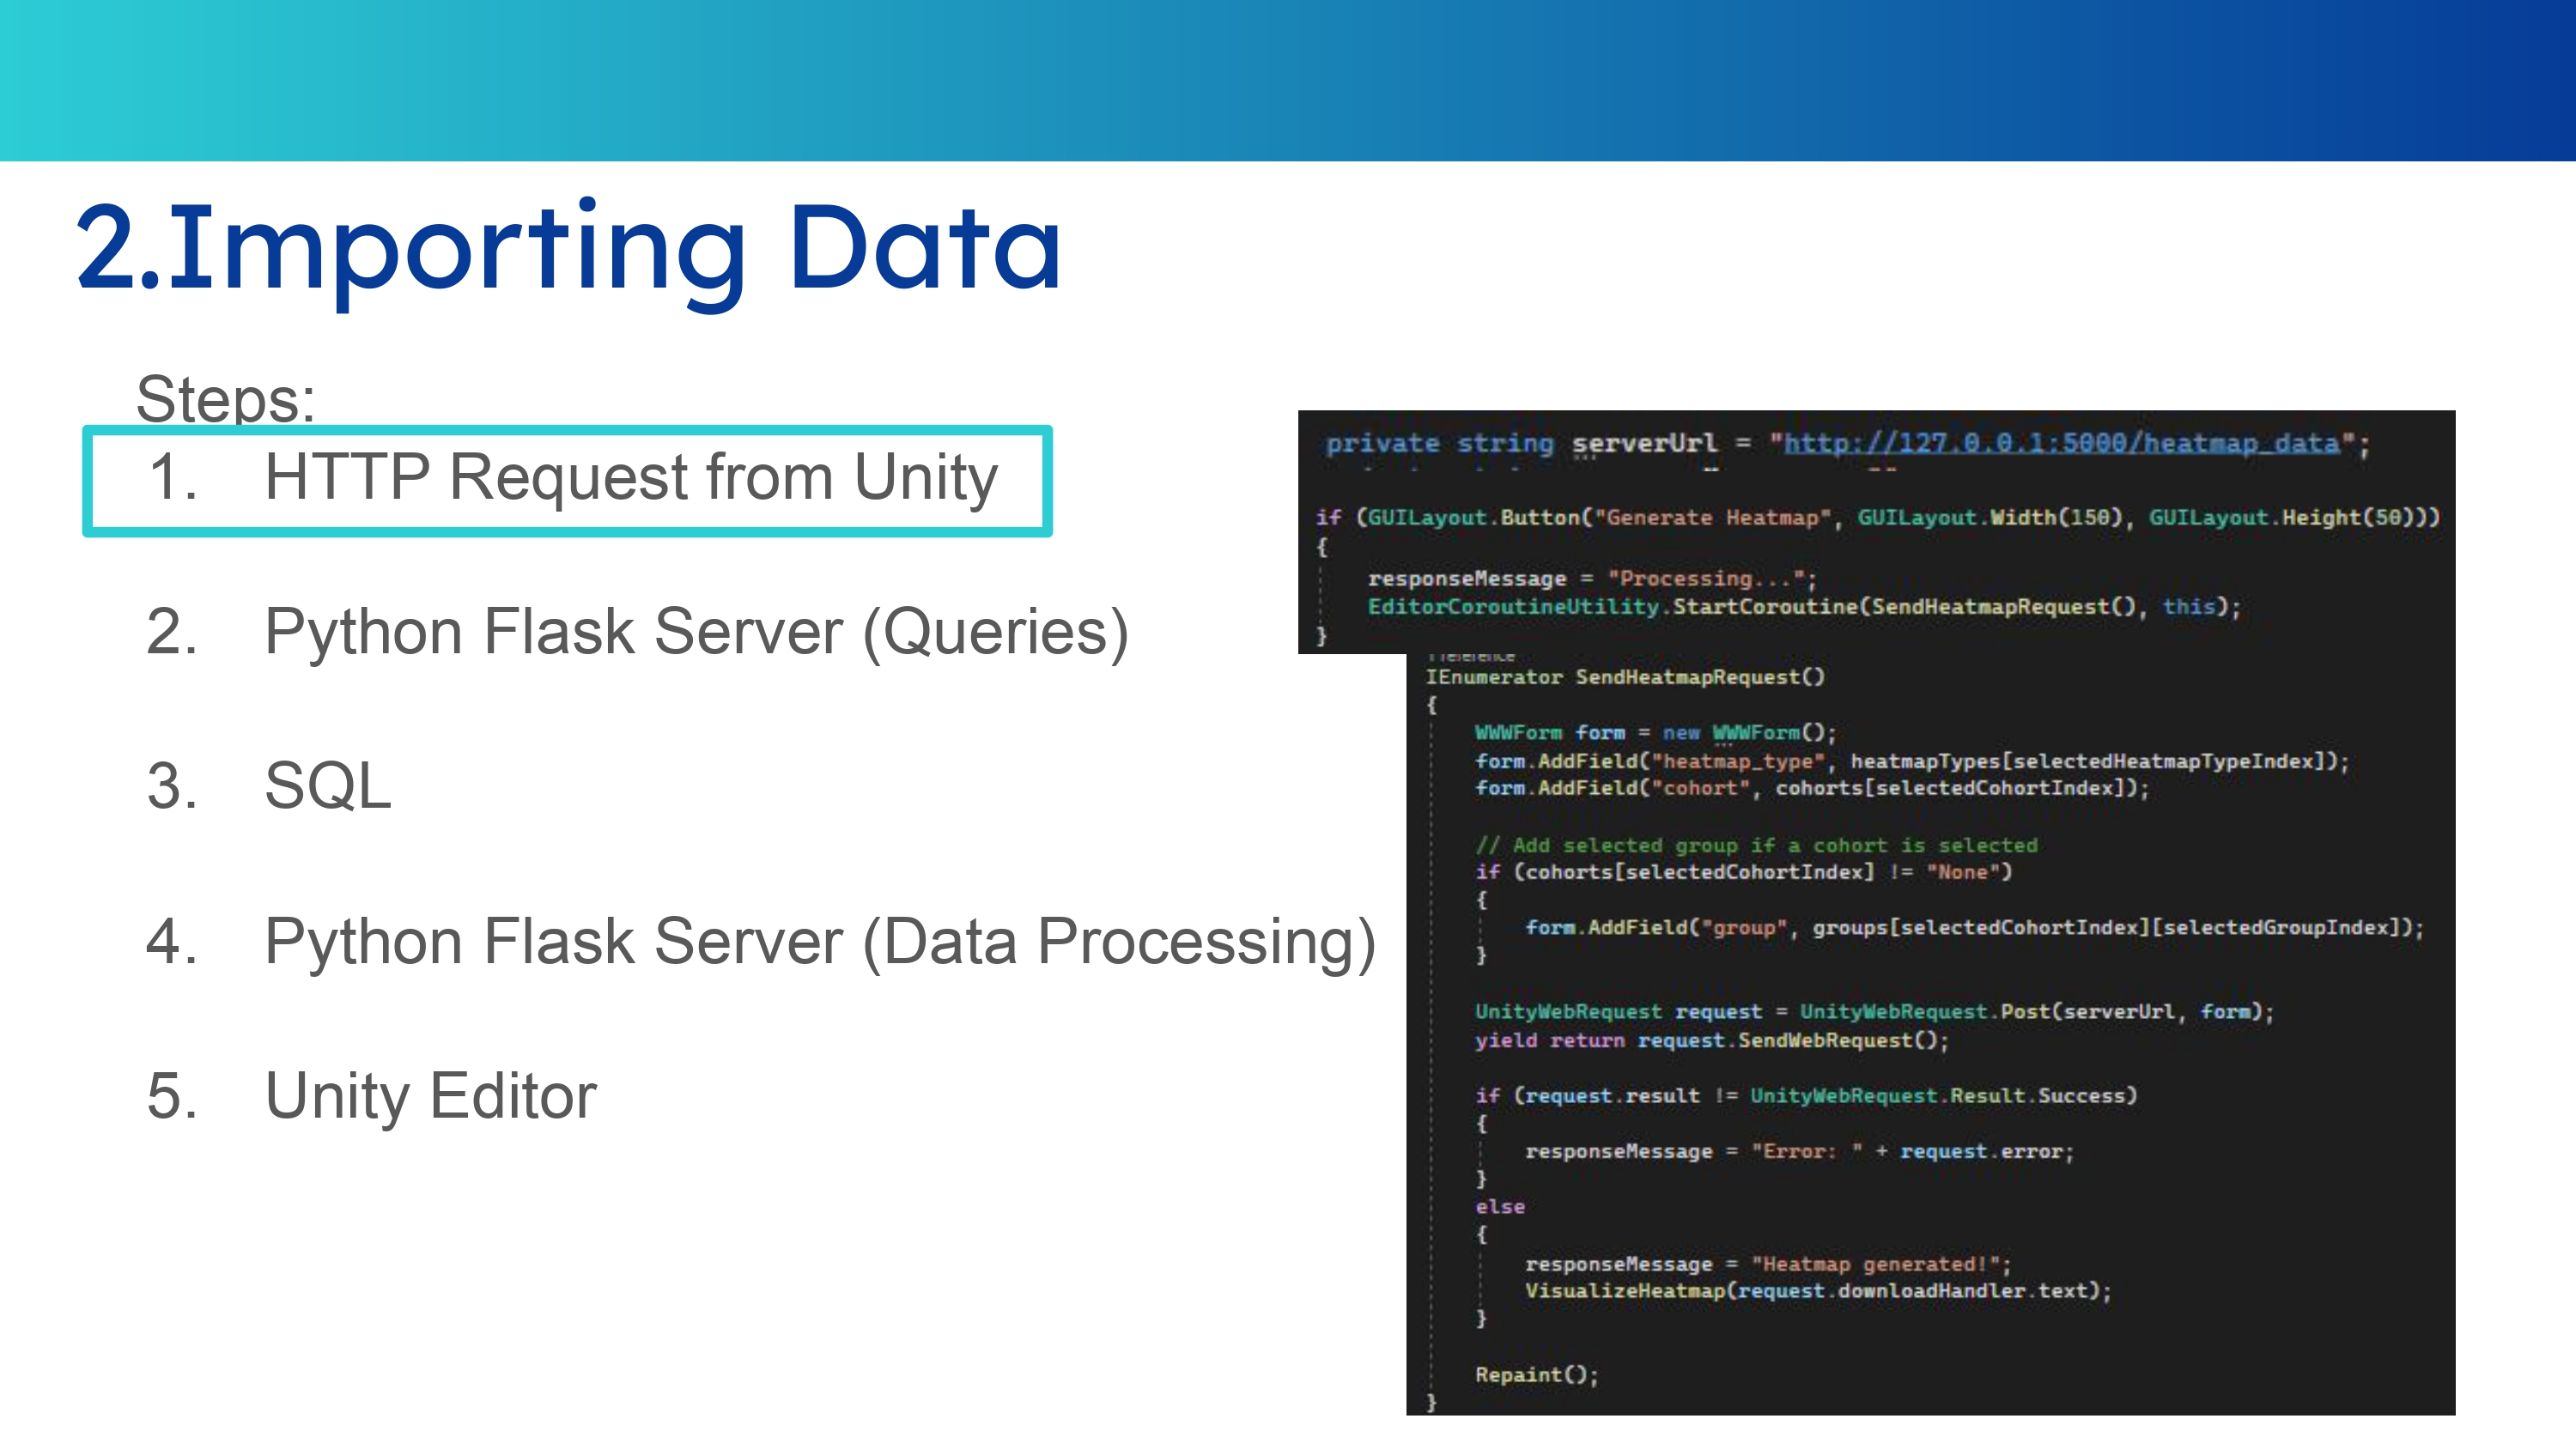
This project focuses on the development of custom data analysis and visualization tools within Unity Engine, designed for analyzing gameplay data from a Minesweeper-inspired game. It leverages Python, SQL, and data science libraries to process and analyze large datasets collected during gameplay.
The tools enable exploratory data analysis (EDA), heatmap visualizations, statistical comparisons, and linear regression modeling directly within Unity. Additionally, machine learning agents (ML-Agents) simulate player behaviors, allowing for the study of exploration patterns and decision-making strategies across different skill levels and demographics.
This tool creates visual representations of player interactions on the game board. I can generate heatmaps showing click density, first clicks, or mine clicks, revealing patterns and tendencies in player behavior.
This tool allows for the visualization of click sequences made by players. With this feature, we can understand how different player types approach the game.
This tool allows for the examination of individual variables such as game duration, click count, and efficiency. It can generate histograms, box plots, and scatter plots to explore distributions and relationships within the data.
This tool allows for the comparison of player groups. It can analyze whether there are significant differences in their performance using statistical tests and visualize the results with bar charts.
This tool investigates the influence of different factors on player outcomes. It can identify which variables, such as age or skill level, have a significant impact on metrics like win rate or score.
To gather diverse gameplay data, I used Unity's ML-Agents to simulate players with varying skill levels – low, medium, and advanced. Each agent represents a different demographic player profile, allowing me to capture a wider range of behaviors.
This video showcases simulations of ML-Agents with varying skill levels (low, advanced, and medium) playing Minesweeper.
The data collected in this project is organized into three SQL tables: Profiles, Games, and Clicks.
Profiles Table:
Stores player information, including ID, age, gender, country, and skill level. A new profile is
created at the
beginning of each ML-Agent episode based on its assigned level, and this profile is sent to the SQL
database.
Contains key details about each game session, such as:
This data is sent to the server at the end of each ML-Agent episode.
Logs detailed data about every click action during gameplay, including:
This information is recorded every time the ML-Agent clicks a cell.
To import the data stored on the server, the process begins with Unity sending an HTTP request.
Instead of querying the SQL database directly through a PHP script, Unity’s request is sent to a Python Flask server. The Flask server acts as a middleware between Unity and the database. It contains multiple scripts, each dedicated to handling requests for specific tools.
When Unity sends a request, Flask executes a SQL query to retrieve the required data from the database. After fetching the data, the Flask server processes it using Python libraries to generate calculations, visualizations, or formatted outputs. Flask then sends the results back to Unity in JSON format, dynamically integrating them into the tools for visualization and analysis.
After fetching the data, the Flask server processes it using Python libraries to generate calculations, visualizations, or formatted outputs. Finally, Flask sends the processed results back to Unity in JSON format, where the data is dynamically integrated into the tools for visualization and analysis. This architecture allows me to perform complex calculations and statistical analysis outside Unity.